MULTI-COMPANY ENVIRONMENT
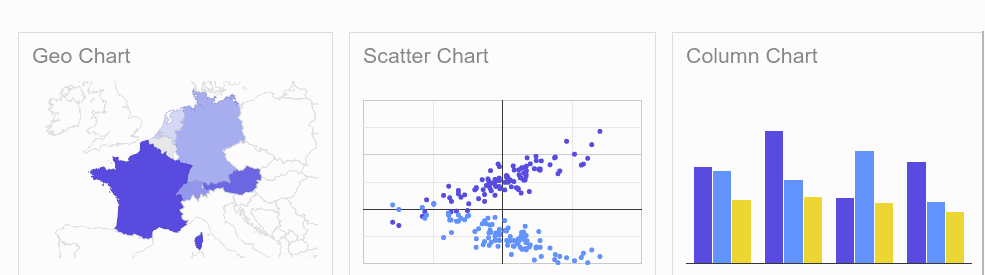
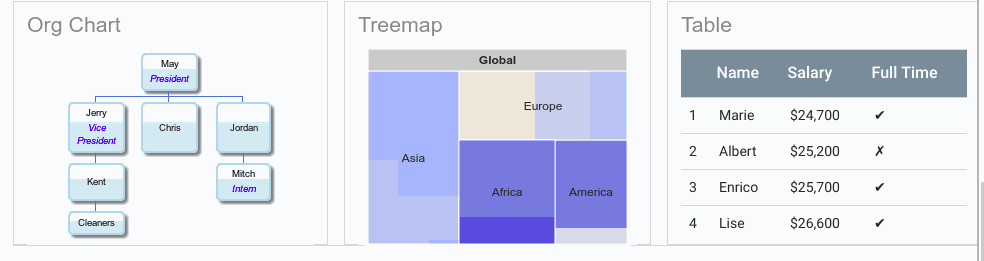
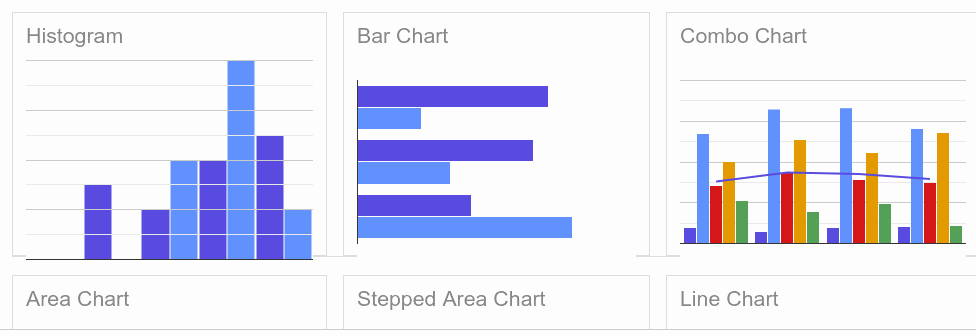
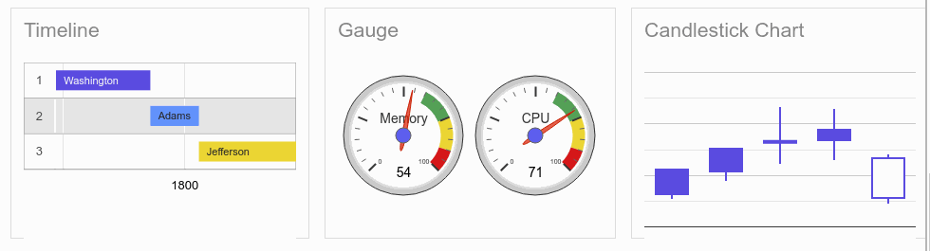
Google chart provides various types of charts to display data in an interactive way. Any chart of google chart can be drawn in Odoo with the help of this application.
Odoo already provides the list, calendar, graph, pivot, Gantt, and pie views, but these views have some kind of limitations, overcome limitations google dashboard are a most suitable way to integrate with Odoo.
Want to display live data on-site?
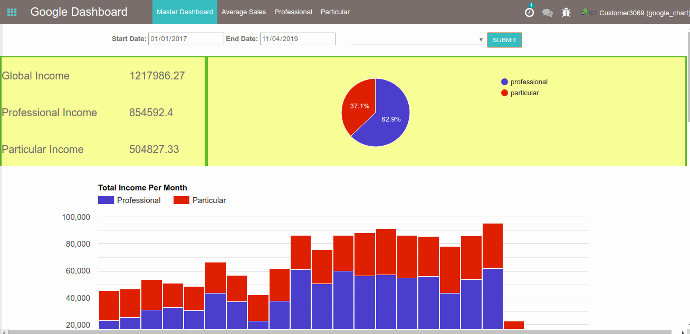
1. Master Dashboard
It has information about global income, professional income(one kind of child company group), and particular income(one kind of child company group).
-
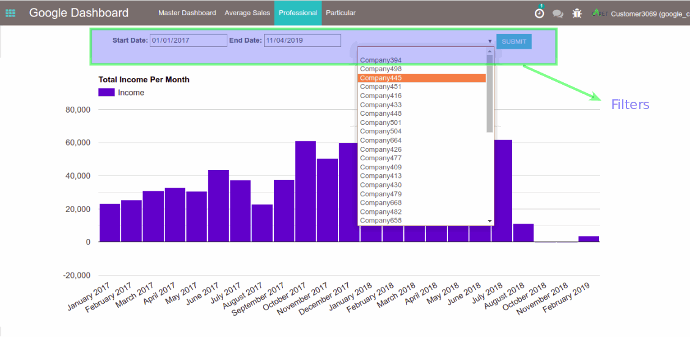
Total Income Per Month
-
Total Sales Of the Month
-
Yearly Comparison of Sale

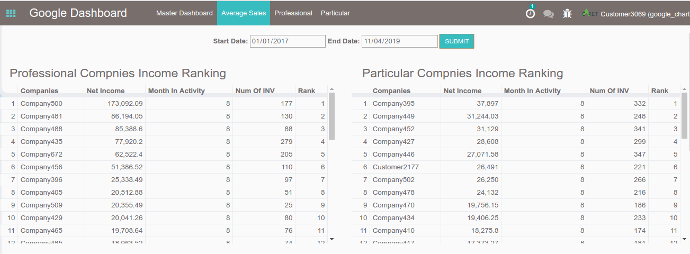
2. The average sale
This dashboard shows the income and product details of company groups.
-
Sales comparison between companies.
-
Number of customers and Products Comparison between Companies.
List of filters and Groups can short data in an easy manner.
-
Business analytics is the calculation of risks and success that can come to an organization’s door after taking any decision.
-
Business analytics helps you in performing predictions like what if the trend continues, what is going to happen next, what’s best for business, what’s worst for a business that can cause problems, and many other predictions.
-
Caret IT offers you the best business analytics services that can help you to make quick decisions and improve the performance of the business with precise guidance.
-
Caret IT helps you to understand the current trend, predict the future, and analyze risks in advance.
-
We have a strong business analyst team that helps to define and manage your strategy, plan, and budget for the profitability of your business. You will always have an upgoing graph to show your senior executives.
