Business Intelligence and Analysis Reporting in Odoo
Business Intelligence software can readily access a company’s information to help companies make effective business decisions and meet their objectives. Odoo provides comprehensive BI functionality to gather, store, access, and analyze corporate data to aid in decision-making.
OBJECTIVES:
- The main objective is to keep an eye on your entire business.
- It easily handles customer databases, supply chain information, personal data, manufacturing, product data, sales, and marketing activity.
- The key point for BI in Odoo is searched and filter functionality. Odoo provides a standardized search box at the top right in all of the lists and kanban views.
- Odoo gives you an easy way to see the statistics about any of your important data. You can create detailed reports and graphs in any format you need. All that in a few simple clicks.
- Track the process of each activity (project, report, invoice, etc.) and get statistical information on all topics. You can see everything in a tabular chart, with a clean breakdown structure.
- Filter and group each analysis using built-in filters, and create custom filters to gather only the information you are looking for. Save the filters you created in your favorites to access them anytime with just a click.
Filter options
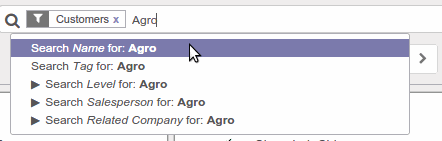
1. Filter by Search
- Odoo provides search view for filter and searches specific data.
- For example, the "customer" filter is already there to open up a customer list. The "Name" filter that limits the customers with that name. When we type any word in the search box, it will now display all available filters in a drop-down list as shown in the image.
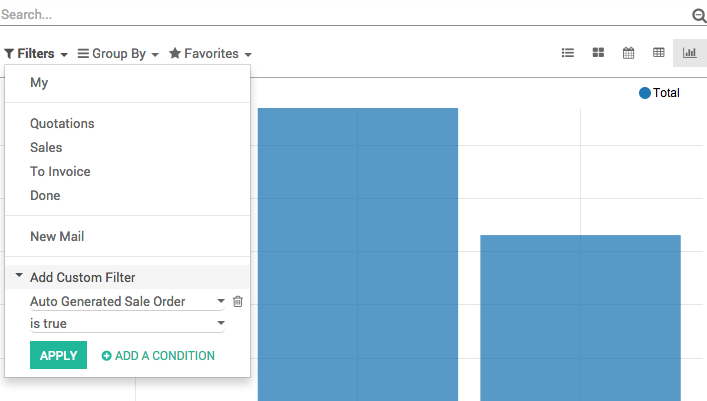
2. Custom Filter
Filter all results to fit your field of research
Filter and group each analysis using built-in filters, and create custom filters to gather only the information you are looking for. Save the filters you created in your favorites to access them anytime in just a click.
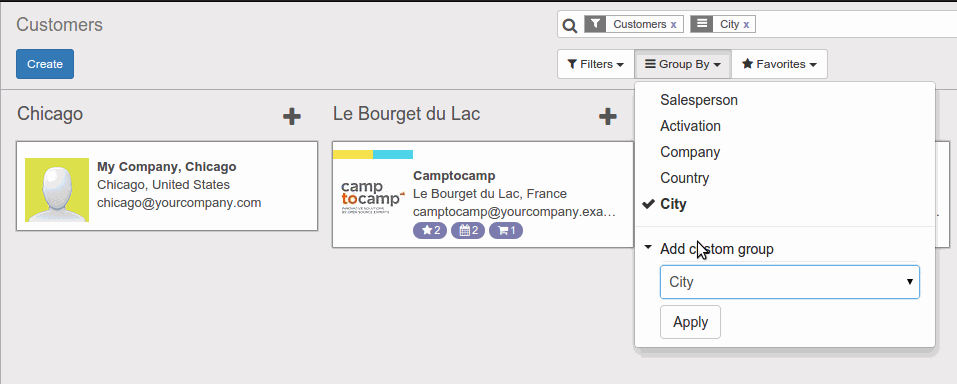
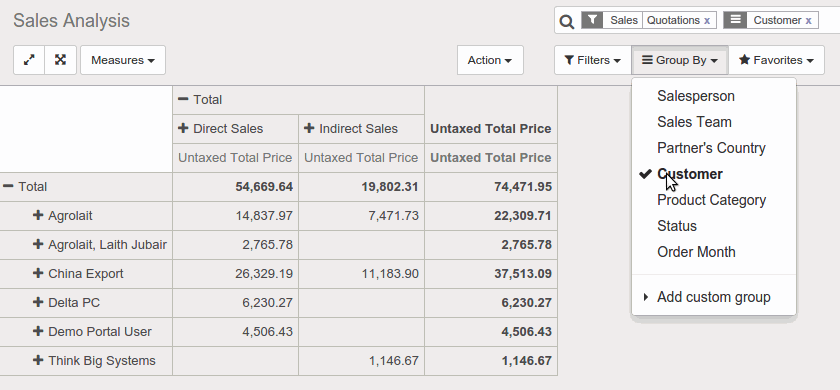
3. Custom Group
We can set custom group by clicking on Group By -> Add custom group as shown in the figure. After clicking on apply button kanban view displays information by each category.
Heat Map:
Keep track of all your important data
This amazing open source system offers you a feature that shows you the heat map, so you can easily understand the progress of all your projects and other activities. You can highlight the data – how many hours were spent on which project/task/etc. It’s useful for tracking the progress and evaluation of each activity.
Pivots View:
It is probably the most important mode. It is a multidimensional table that you can configure to display any possible cube for your data.
The elements allowed within a pivot view are the same as for the graph view.
Track the process of each activity, from projects to reports and invoices, and get statistical information on all topics, in a simple and clear tabular chart. Get a clear overview of your whole activity and be ready for new challenges.
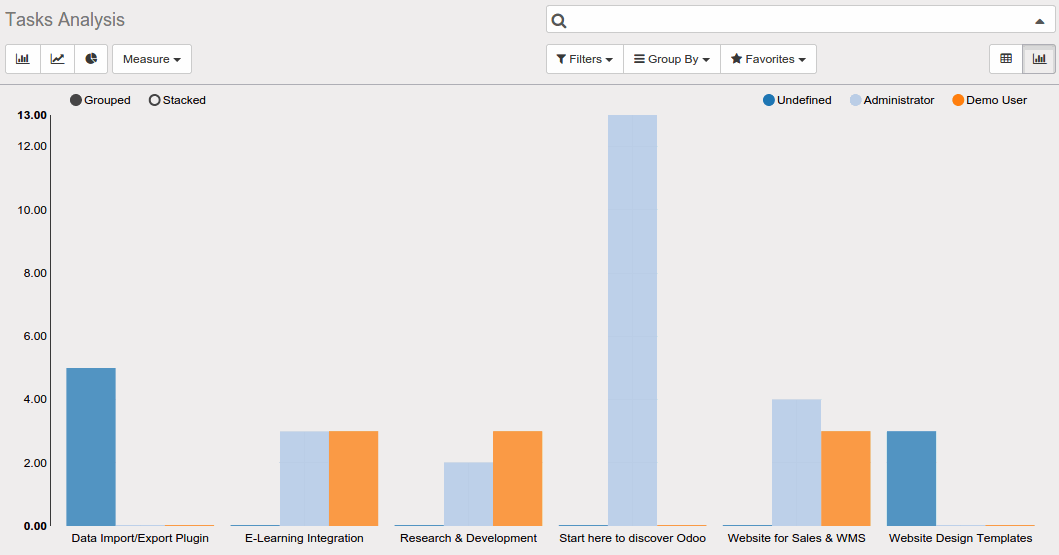
Graph View:
Another key point for BI in Odoo is the Graph view to see the statistics about any of important data in a few simple clicks. graph view shows data in various ways like the Bar chart, Line chart, and pie chart.
To do its work, the graph view understands two kinds of fields:
Measure: A measure is a field that can be aggregated (right now, the only aggregation method is the sum). Every field of type integer or float (except the id field) can be used as a measure.
Dimension: A dimension is a field that can be grouped. That means pretty much every non-numeric fields.
Track the process of each activity (project, report, invoice,..) and get statistical information on all topics. We can see everything in a bar chart, with clean breakdown structure as shown in the figure.